by James W. Harper,B.Sc.EE
Note: This work is a collection of ideas from many others and myself. I am acting as a system integrator to cull these concepts together as to form a reference document. In many cases I have just cut and pasted information from other sources. I want to make that clear up front. I plan to add credit ref area in this document.
2019
Chapter 1
Hypothesis : Past performance is a predictor of future success!
Objective: > 5% per month return
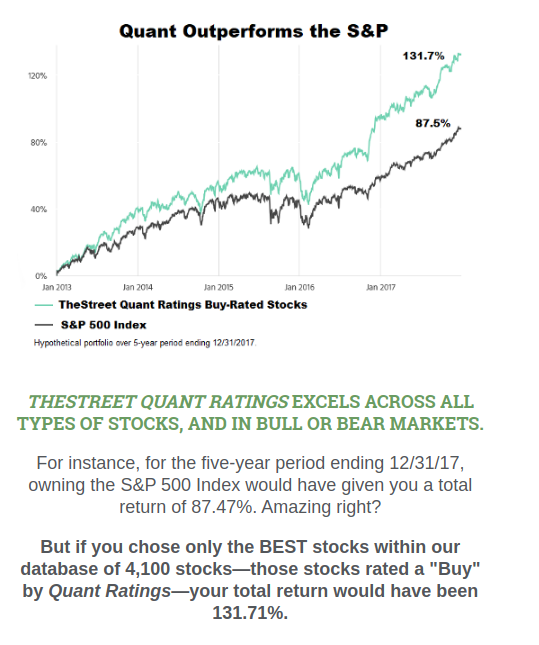
From The Street Quant A Rating: See Ref 1 below.
A (Excellent) – The stock has an excellent track record for maximizing performance while minimizing risk, thus delivering the best possible combination of total return on investment and reduced volatility. It has made the most of the recent economic environment to maximize risk-adjusted returns compared to other stocks. While past performance is just an indication — not a guarantee — we believe this fund is among the most likely to deliver superior performance relative to risk in the future as well.
The data below gives a performance CACR=18%+ over 5 years
- Algorithm –
- For every month,
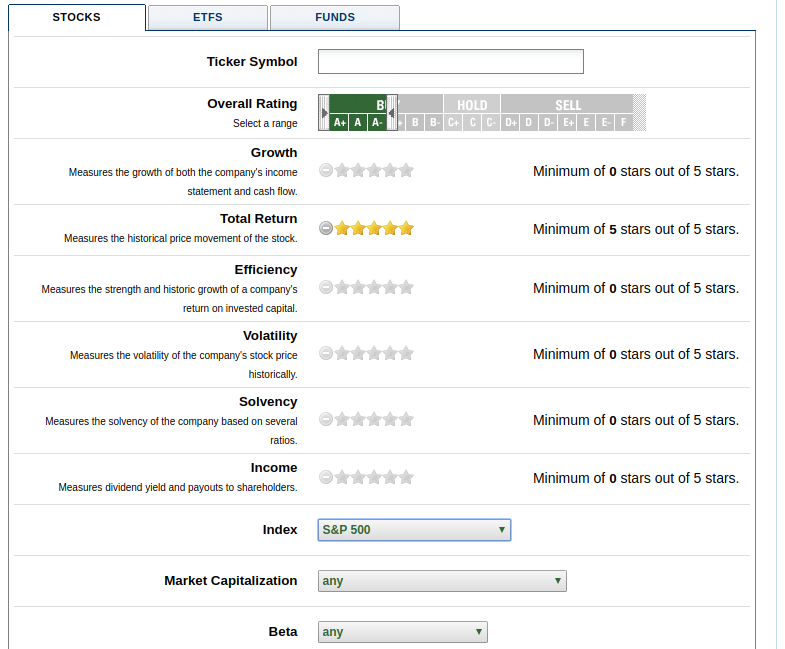
- Screen{search} for all A stocks in the SP500 index with a Total Return=5
- https://www.thestreet.com/r/ratings/reports/ir-screener.html
- Sort list from A+ to A-
- Finally update the portfolio with the new monthly top 10
- Use a robo advisor like M1 ,Folio or Robinhood for example.But now any zero commission broker will work.
Ref 1
https://www.thestreet.com/r/ratings/reports/ir-screener.html
Ref 2
https://www.calculator.net/investment-calculator.html
Ref 3
http://www.superstockscreener.com/companies/ratings/strong-buy
Ref 4
https://www.macrotrends.net/stocks/stock-screener
Chapter 2
The use of AI
New Research ===============================================
The quantitative investor uses computational methods for stock market investing. Often people have no idea on how to pick a stock that will give them an acceptable return over time. The answer lies in what are the predictive financial metrics that make a stock “good” or “bad”? In other words,there exist some function F such that F(financial metrics)=Label “Good Stock”|”Bad Stock” .We can answer this question with the help of an AI, a machine learning model to learn this function F based a stocks’s financial data . For each stock given a list for various financial metrics we pass this through an auto-encoder. This will constrain the latent space metric factors to the ones that are most important in producing the label “good stock” or “bad stock”.We then use a search algorithm to search the stocks that are located in “Good Stock” latent space. Next I will go into the mathematics.

Xi is the input vector[ stock,good|bad,financial metrics 1 to i].
X^i is the same the input that is forced through a bottleneck h(x).
h(x) is the latent space metrics that are used in the search.
The network is trained with stock market data that such that the error between the input and the output are small as possible. We will use the cross entropy error metric.
1. Picking the right stock can be recast as a search problem , a prediction model based on some casual objective factors !
- use Quaint Tools as a search engine
- Stock Screener
- Quant Ratings
Ref 1
https://www.thestreet.com/r/ratings/reports/ir-screener.html
Search( A+ rating , Large Cap) = Return list of stocks see table 1 below
2. Compound Growth to build wealth over time:
A=P(1+r/n)(nt)
Future value of a series:
A=PMT × {[(1 + r/n)(nt) – 1] / (r/n)} × (1+r/n)
Where:
- A = the future value of the investment/loan, including interest
- P = the principal investment amount (the initial deposit or loan amount)
- PMT = the monthly payment
- r = the annual interest rate (decimal)
- n = the number of times that interest is compounded per unit t
- t = the time (months, years, etc) the money is invested or borrowed for
Use Tool:
Ref 2
http://www.moneychimp.com/calculator/compound_interest_calculator.htm
3. Investment Platforms/Online Brokers
Ref 3
https://dashboard.m1finance.com/login
4. Result of search
search( A+ rating , Large Cap) as of 10/08/2019
Table 1
|
|
|
|
|
|
|
NYSE
|
|
|
Buy
|
A+
|
|
NASDAQ
|
|
|
Buy
|
A+
|
|
NYSE
|
|
|
Buy
|
A+
|
|
NYSE
|
|
|
Buy
|
A+
|
|
NYSE
|
|
|
Buy
|
A+
|
|
NASDAQ
|
|
|
Buy
|
A+
|
|
NYSE
|
|
|
Buy
|
A+
|
|
NASDAQ
|
|
|
Buy
|
A+
|
|
NYSE
|
|
|
Buy
|
A+
|
|
NYSE
|
|
|
Buy
|
A+
|
|
NYSE
|
|
|
Buy
|
A+
|
|
NASDAQ
|
|
|
Buy
|
A+
|
|
NYSE
|
|
|
Buy
|
A+
|
|
NYSE
|
|
|
Buy
|
A+
|
|
NASDAQ
|
|
|
Buy
|
A+
|
|
NYSE
|
|
|
Buy
|
A+
|
|
NYSE
|
|
|
Buy
|
A+
|
|
NYSE
|
|
|
Buy
|
A+
|
|
NYSE
|
|
|
Buy
|
A+
|
|
NASDAQ
|
|
|
Buy
|
A+
|
|
NYSE
|
|
|
Buy
|
A+
|
